Earlier this week, the Chicago area experienced some unseasonably cool weather as a low-pressure system from Canada caused a cold front to make its way across the Midwest. While cold fronts like this happen across the country, areas like Chicago and Milwaukee are prone to a unique kind of cold snap. It’s called a Pneumonia Front.
According to Max Grover, a data scientist at the Department of Energy’s Argonne National Laboratory and a member of the CROCUS Measurement Strategy Team, “This is a term originally coined by meteorologists in Milwaukee, Wisconsin that refers to a strong cold front around the Great Lakes that leads to temperatures cooling very quickly, at a rate of at least 16 degrees Fahrenheit in one hour.”
Grover says that these fronts can be quite common in the spring along the western coast of Lake Michigan as the still-cold waters of the lake interact with the warmer air temperatures on land. Although we think of the lake as impacting only the nearby shoreline, people in Illinois have felt the effects of Pneumonia Fronts as far west as Will and DuPage counties, miles inland from the lake.
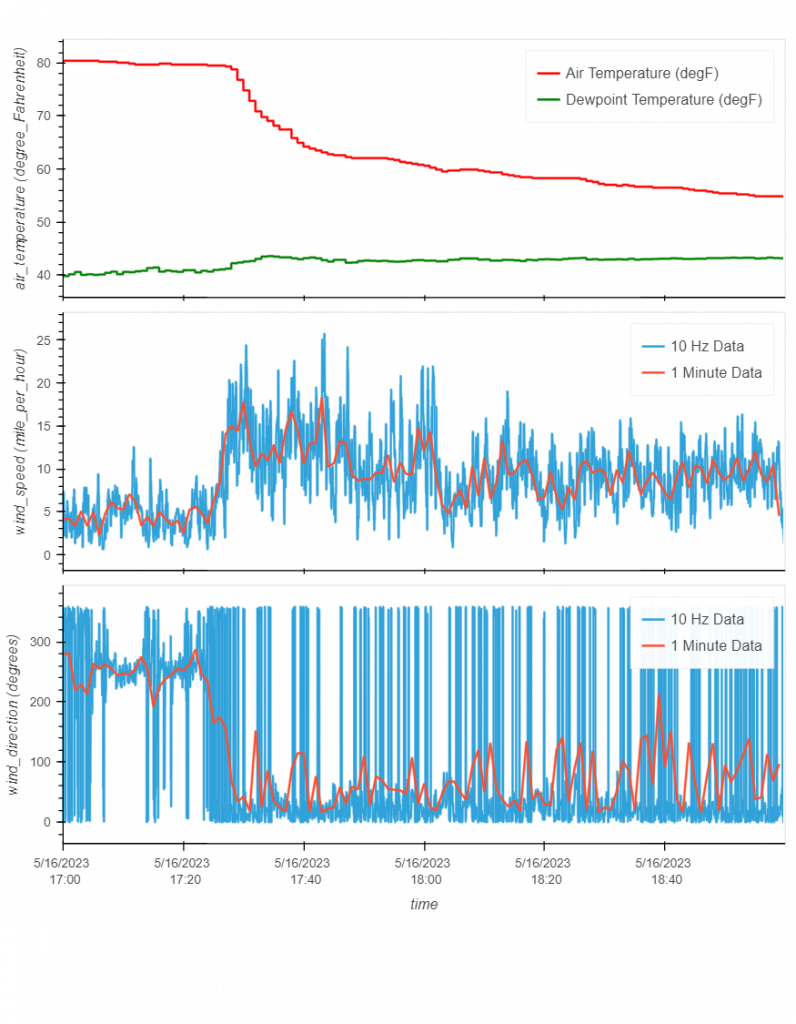
On May 16, the CROCUS team was able to use the sensor array at Northeastern Illinois University to capture a Pneumonia Front’s quick change in temperature, wind speed and wind direction. While data about weather events is important in helping us make evening plans or decide whether to bring a sweater when we go out, it’s also vital in our long-term planning for the region. Getting data on when, where, why, and how often things like Pneumonia Fronts happen will help us understand and predict future extreme weather events and long-term shifts in climate so that people, neighborhoods, and cities can make informed decisions and stay safe. Check out the case study created by the CROCUS Measurement Strategy Team: Pneumonia Front (May 16, 2023) — CROCUS Instrument Cookbooks (crocus-urban.github.io)
The visualizations below show the temperature (red), dewpoint (green), and wind speed and direction (blue) recorded on the roof of Bernard J. Brommel Hall at Northeastern on May 16, 2023. Note the temperature drop and increase in wind speed at approximately 5:30 PM.